11.2.1 Diagramming reactive flows
Reactive flows are often illustrated with marble diagrams. Marble diagrams, in their simplest form, depict a timeline of data as it flows through a Flux or Mono at the top, an operation in the middle, and the timeline of the resulting Flux or Mono at the bottom. Figure 11.1 shows a marble diagram template for a Flux. As you can see, as data flows through the original Flux, it’s processed through some operation, resulting in a new Flux through which the processed data flows.
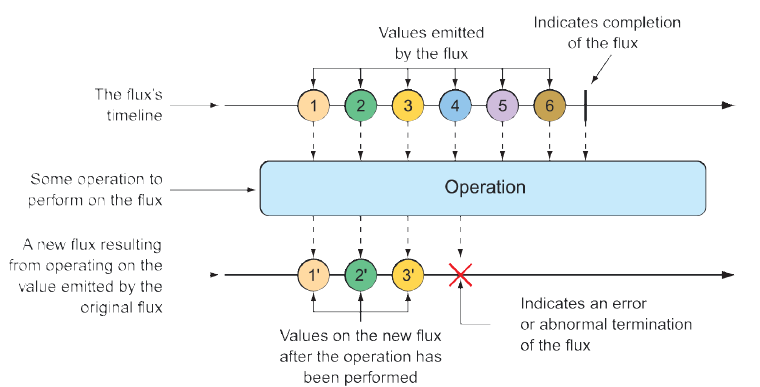 Figure 11.1 Flux Marble diagram illustrating the basic flow of a
 Flux
Figure 11.2 shows a similar marble diagram, but for a Mono. As you can see, the key difference is that a Mono will have either zero or one data item, or an error.
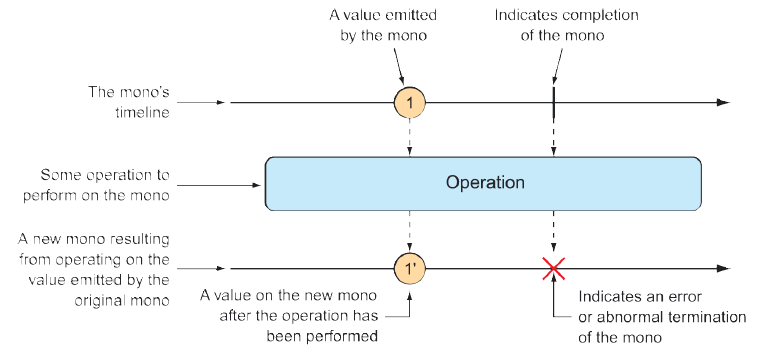 Figure 11.2 Marble diagram illustrating the basic flow of a
 Mono
In section 11.3, we’ll explore many operations supported by Flux and Mono, and we’ll use marble diagrams to visualize how they work.