16.2.2 Watching key metrics
The information presented by the /metrics endpoint is perhaps the least humanreadable of all of the Actuator’s endpoints. But the Admin server makes it easy for us mere mortals to consume the metrics produced in an application with its UI under the Metrics menu item.
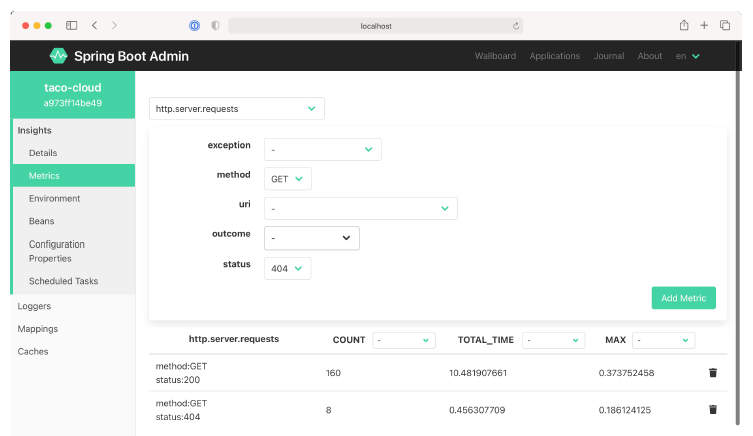 Figure 16.6 On the Metrics screen, you can set up watches on any metrics published through the application’s /metrics endpoint.
Initially, the Metrics screen doesn’t display any metrics whatsoever. But the form at the top lets you set up one or more watches on any metrics you want to keep an eye on.
In figure 16.6, I’ve set up two watches on metrics under the http.server.requests category. The first reports metrics anytime an HTTP GET request is received and the return status is 200 (OK). The second reports metrics for any request that results in an HTTP 404 (NOT FOUND) response.
What’s nice about these metrics (and, in fact, almost anything displayed in the Admin server) is that they show live data—they’ll automatically update without the need to refresh the page.